Hydraulic Design
Pipelines should be designed to accommodate expected discharge, while also ensuring self-cleansing is achieved. A velocity between 0.75m / sec and 4.0m / sec, is considered satisfactory for self-cleaning when flowing half full.
COLEBROOK – WHITE EQUATION
A number of formulas have been developed to assist in hydraulic calculations to determine flow rates in pipelines. The Colebrook – White equation is considered most accurate for commercial pipes as effective roughness is applied.
The equation expressed in Engineering terms is as follow:
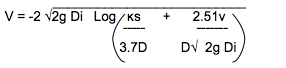
Where:
V = Velocity
G = Gravitational acceleration (9.81 m/s)
i = Hydraulic gradient (m/m) D = Pipe internal diameter (m)
ks = Hydraulic
v = Kinematic viscosity of fluid (1.31 x 10m2/s)
Now Q can be calculated using Q = VR (m3/s)
Where:
Q = Discharge (m3/s)
V = Velocity (m/s)
R = Hydraulic Radius = ![]()
D = Internal Diameter of pipe
DESIGN CHARTS
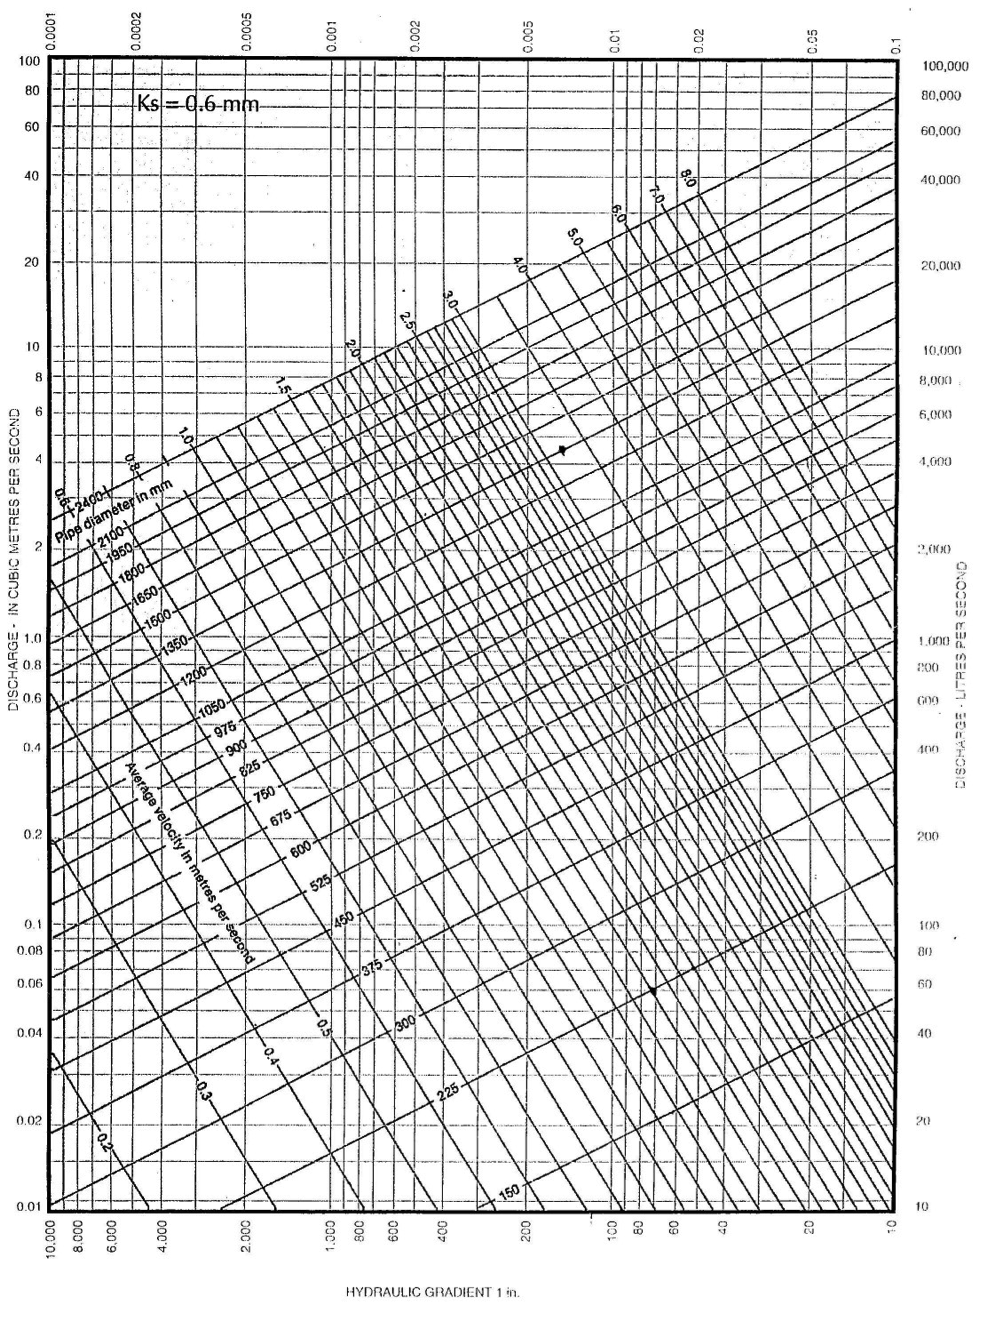
BS 8005:Part 1 1987, contains hydraulic flow charts based on the Colebrook – White equation for calculating transitional flow.
Two such charts have been included to simplify calculations. Each has a different roughness factor (ks) and should be used as follows:-
Foul and combined sewers ks = 1.5mm Surface water sewers ks = 0.6mm
The velocities and discharges given in the hydraulic flow charts are for circular concrete pipes flowing full. If the pipes are partially full the proportional discharge and velocity values, can be taken off the partial flow chart provided.
Example
Design of Surface Water Sewer
Pipeline length = 300m
Difference in level between inlet and outlet = 2m
Design discharge = 500L/S
To determine:
a) Adequate pipe size when flowing full
b) Discharge and Velocity when flowing 70% full
c) Determine if the velocity is satisfactory for self-cleansing
Solution
Hydraulic Gradient 1 in 150 (or 0.0066)
Ks for surface water sewer 0.6mm
a) Flowing Full
Refer to hydraulic flow chart ks = 0.6mm
The intersection of the horizontal discharge line of 500 L/S (0.5m3/sec) with the vertical hydraulic gradient line of 1 in 150 gives:
Pipe Diameter 600mm
Average Velocity 1.95 m/sec
Discharge 550 L/S
b) Discharge and Velocity when flowing 70% full
Refer to the graph showing Relative Velocity and flow in circular pipes for any depth of flow. The intersection of the horizontal proportional depth line of 0.7 with the proportional discharge and velocity curves gives:
Proportional Discharge 0.84
Proportional Velocity 1.12
Therefore:
Actual Discharge 0.84 x 550 = 462 L/sec
Actual Velocity 1.12 x 1.95 = 2.18 m/sec
c) Check if self-cleansing is achieved when flowing half full
Refer again to Relative Velocity and flow chart. When the discharge is 0.5 the proportional velocity is 1.0,
=> 1.0 x 1.95 = 1.95m/sec, 0.75 < 1.95 < 4.0 therefore satisfactory.
Relative Velocity and Flow in Circular Pipe for any Depth of Flow
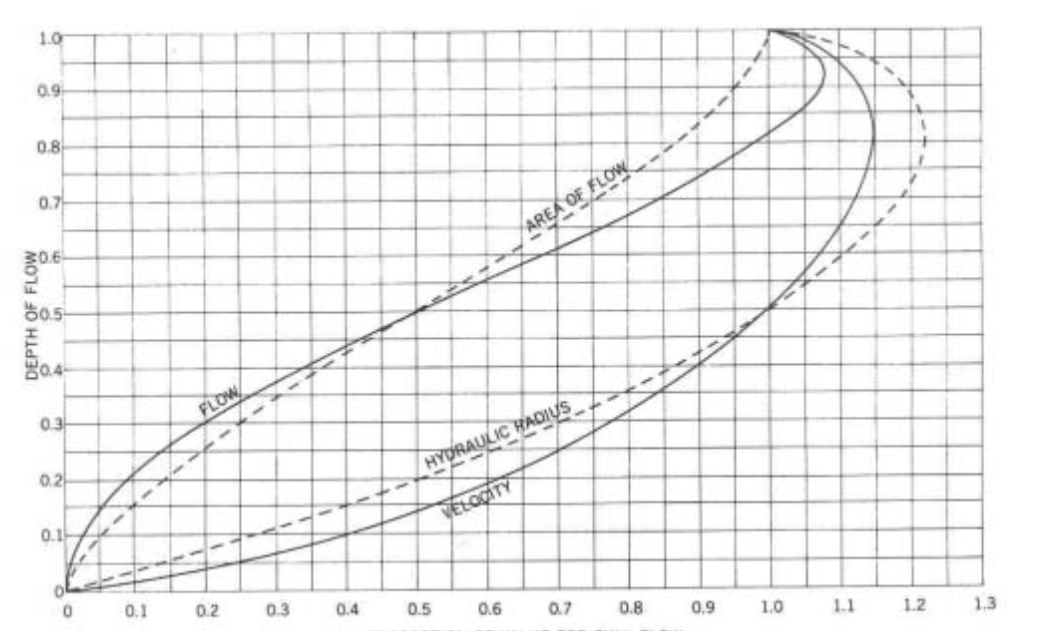
NOTE: This graph complies with B.S. 8005: part 1 1987
Flow Chart No.1
(Colebrook – White) Water at 15°C
Strom
NOTE: This graph complies with B.S. 8005: part 1 1987
Flow Chart No.2
(Colebrook – White) Water at 15°C
Sanitary
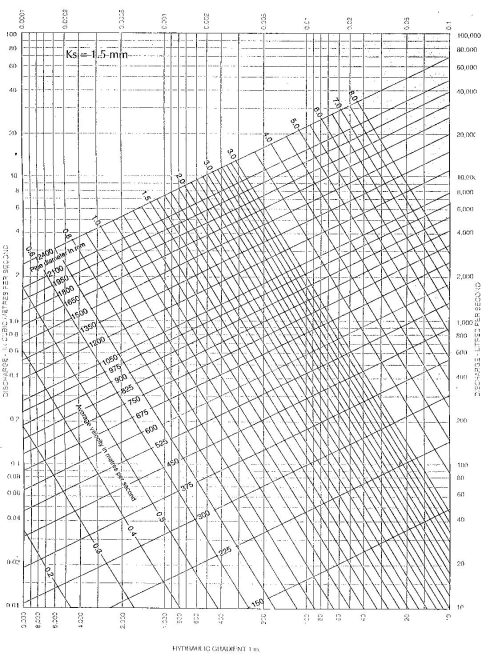
NOTE: This graph complies with B.S. 8005: part 1 1987
Would you like to talk to us about your requirements?
Download our Concrete brochure